Prometheus.io is an open-source monitoring and alerting toolkit widely used in the IT industry, empowering organizations to gather and analyze metrics from their systems to ensure optimal performance and reliability. The integration between Prometheus and Togai requires only a one-time setup. Follow the steps below:Documentation Index
Fetch the complete documentation index at: https://docs.togai.com/llms.txt
Use this file to discover all available pages before exploring further.
Install
- Navigate to the Integrations section from the left navigation bar in Togai
- Click on
Appsto access the list of apps with integration support - Select
Prometheusfrom the available apps - Click on the
+Add connectionbutton - Provide a name for the connection and paste your:
Base URL
Base URL

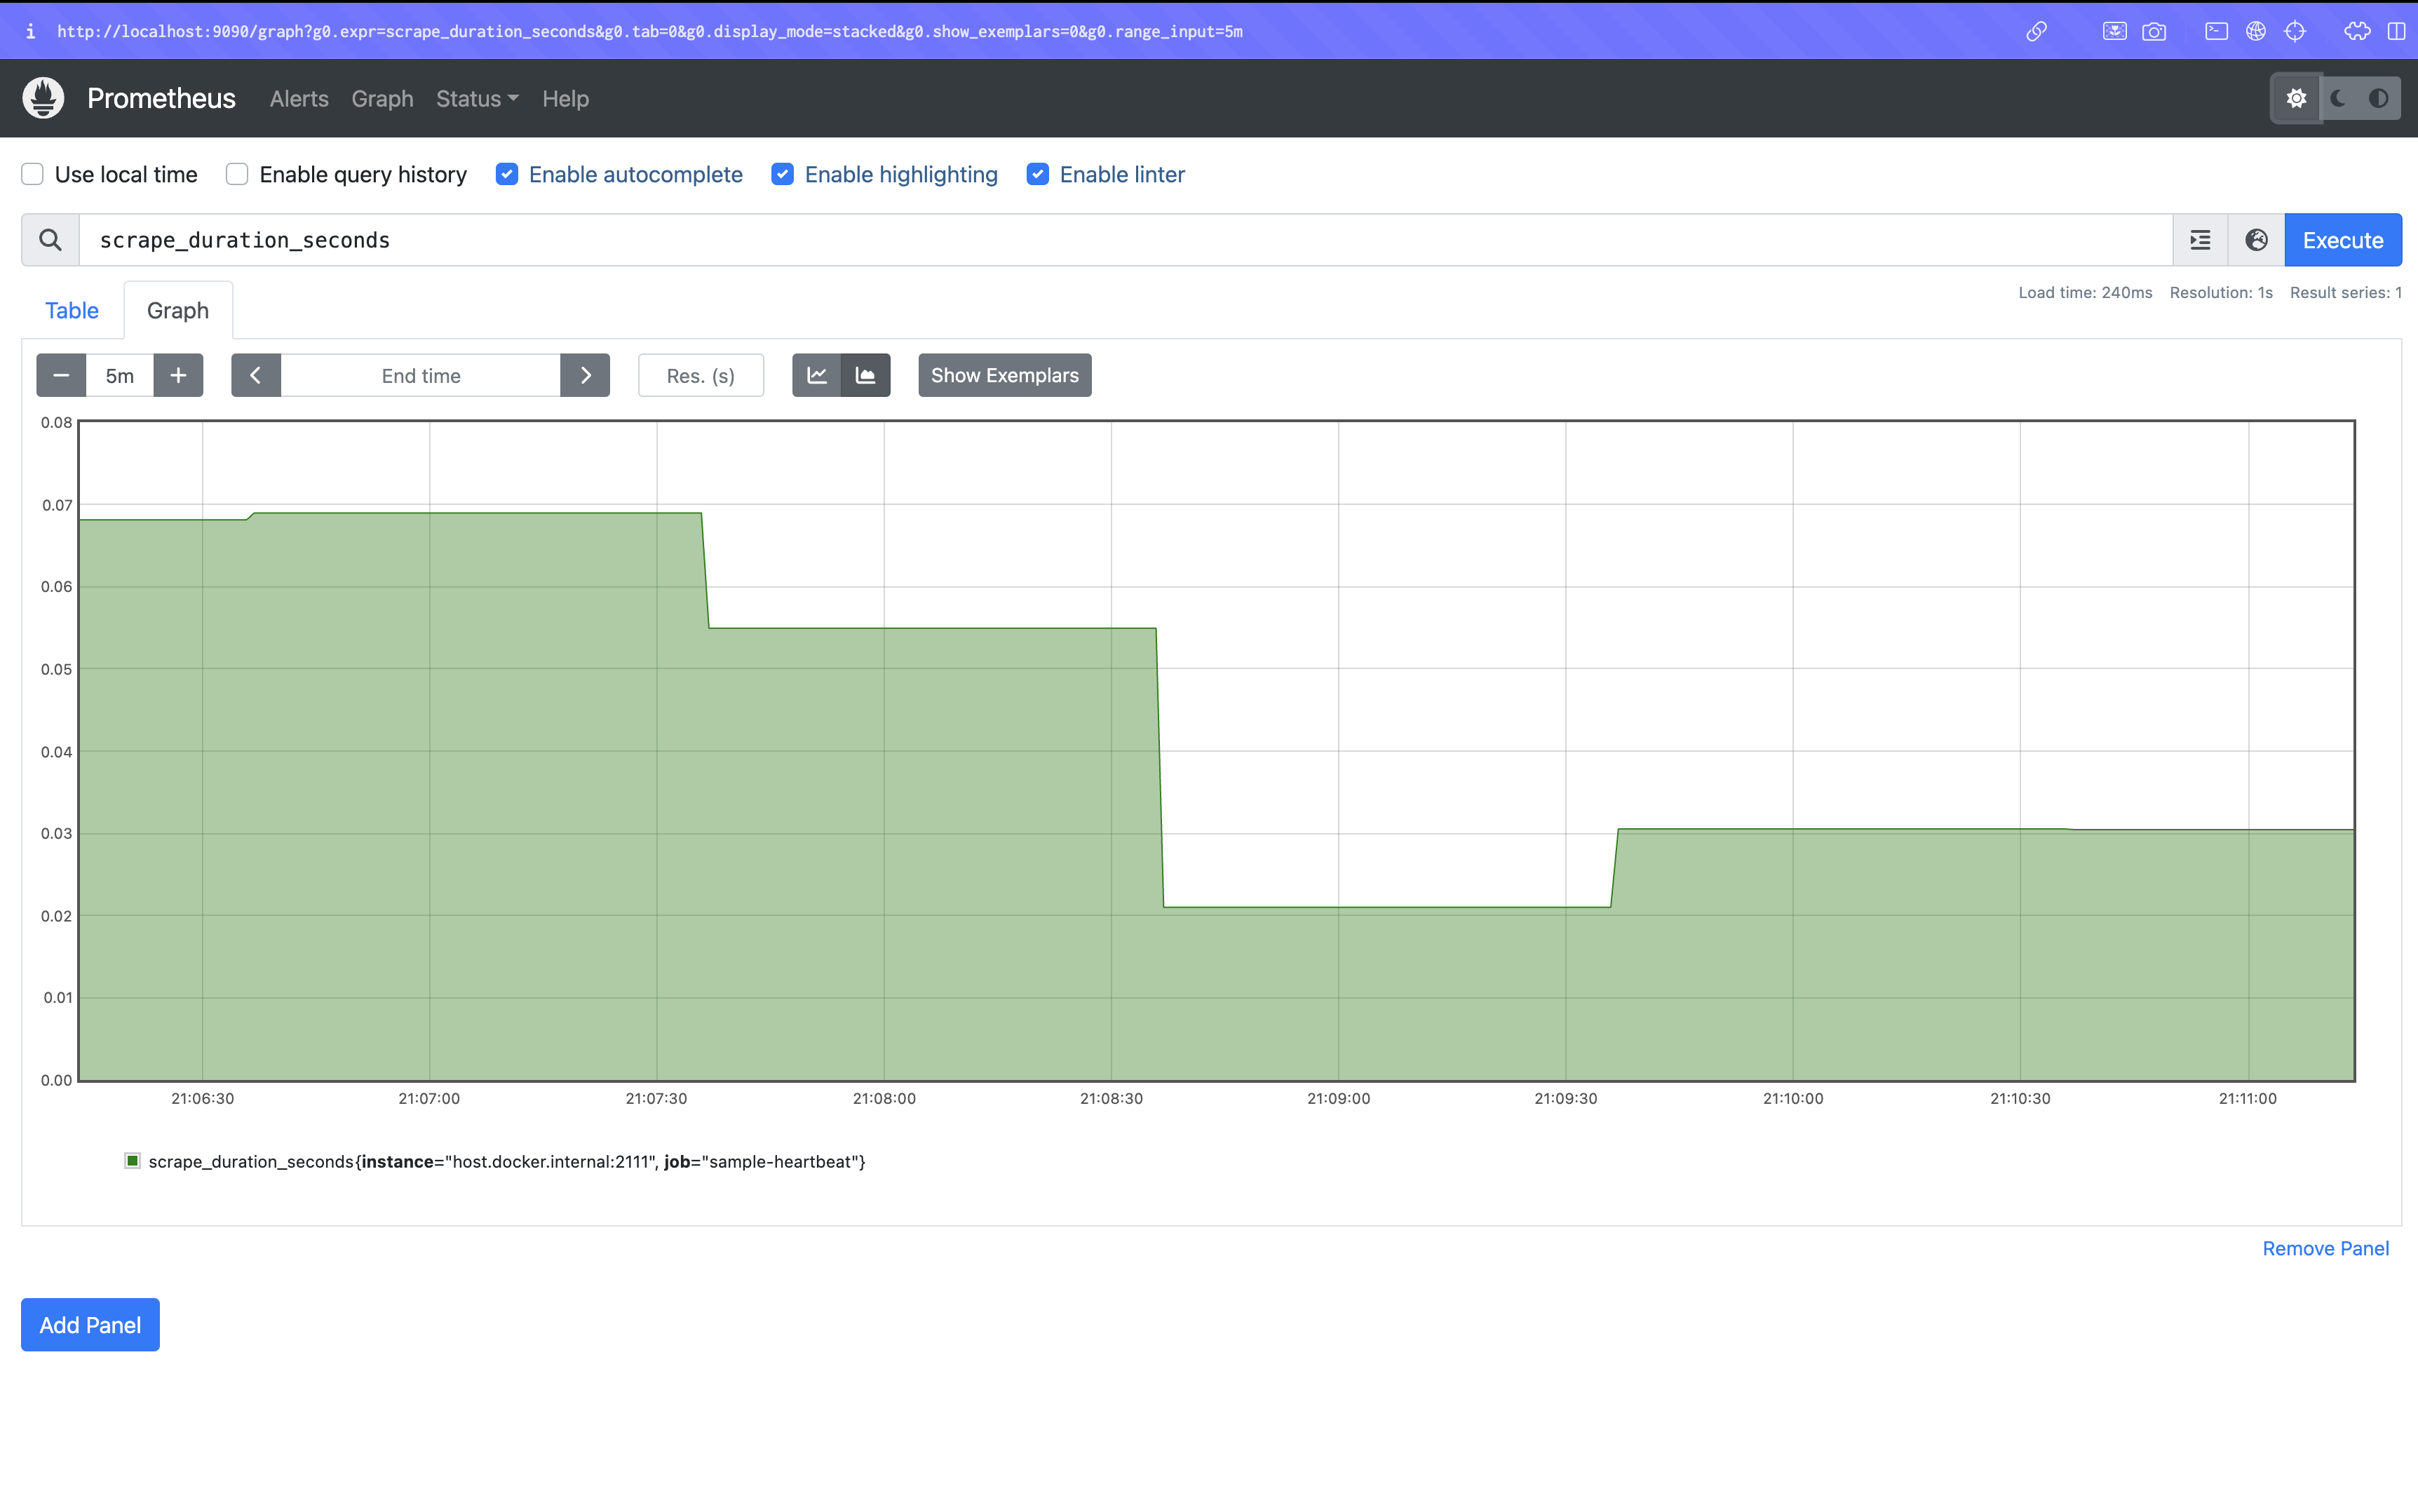
- Obtain the network address of your Prometheus instance. This is the address you use to access the Prometheus server. It is usually in the format
http://<prometheus-server-ip>:<prometheus-service-port>. For example,http://localhost:9090when running locally. - Paste the network address in the
Base URLfield in Togai.
Flows
1. Ingest data from Prometheus
- The flow can be triggered by on demand triggered.
- Create flow connection by choosing the appropriate app connections from the dropdown.

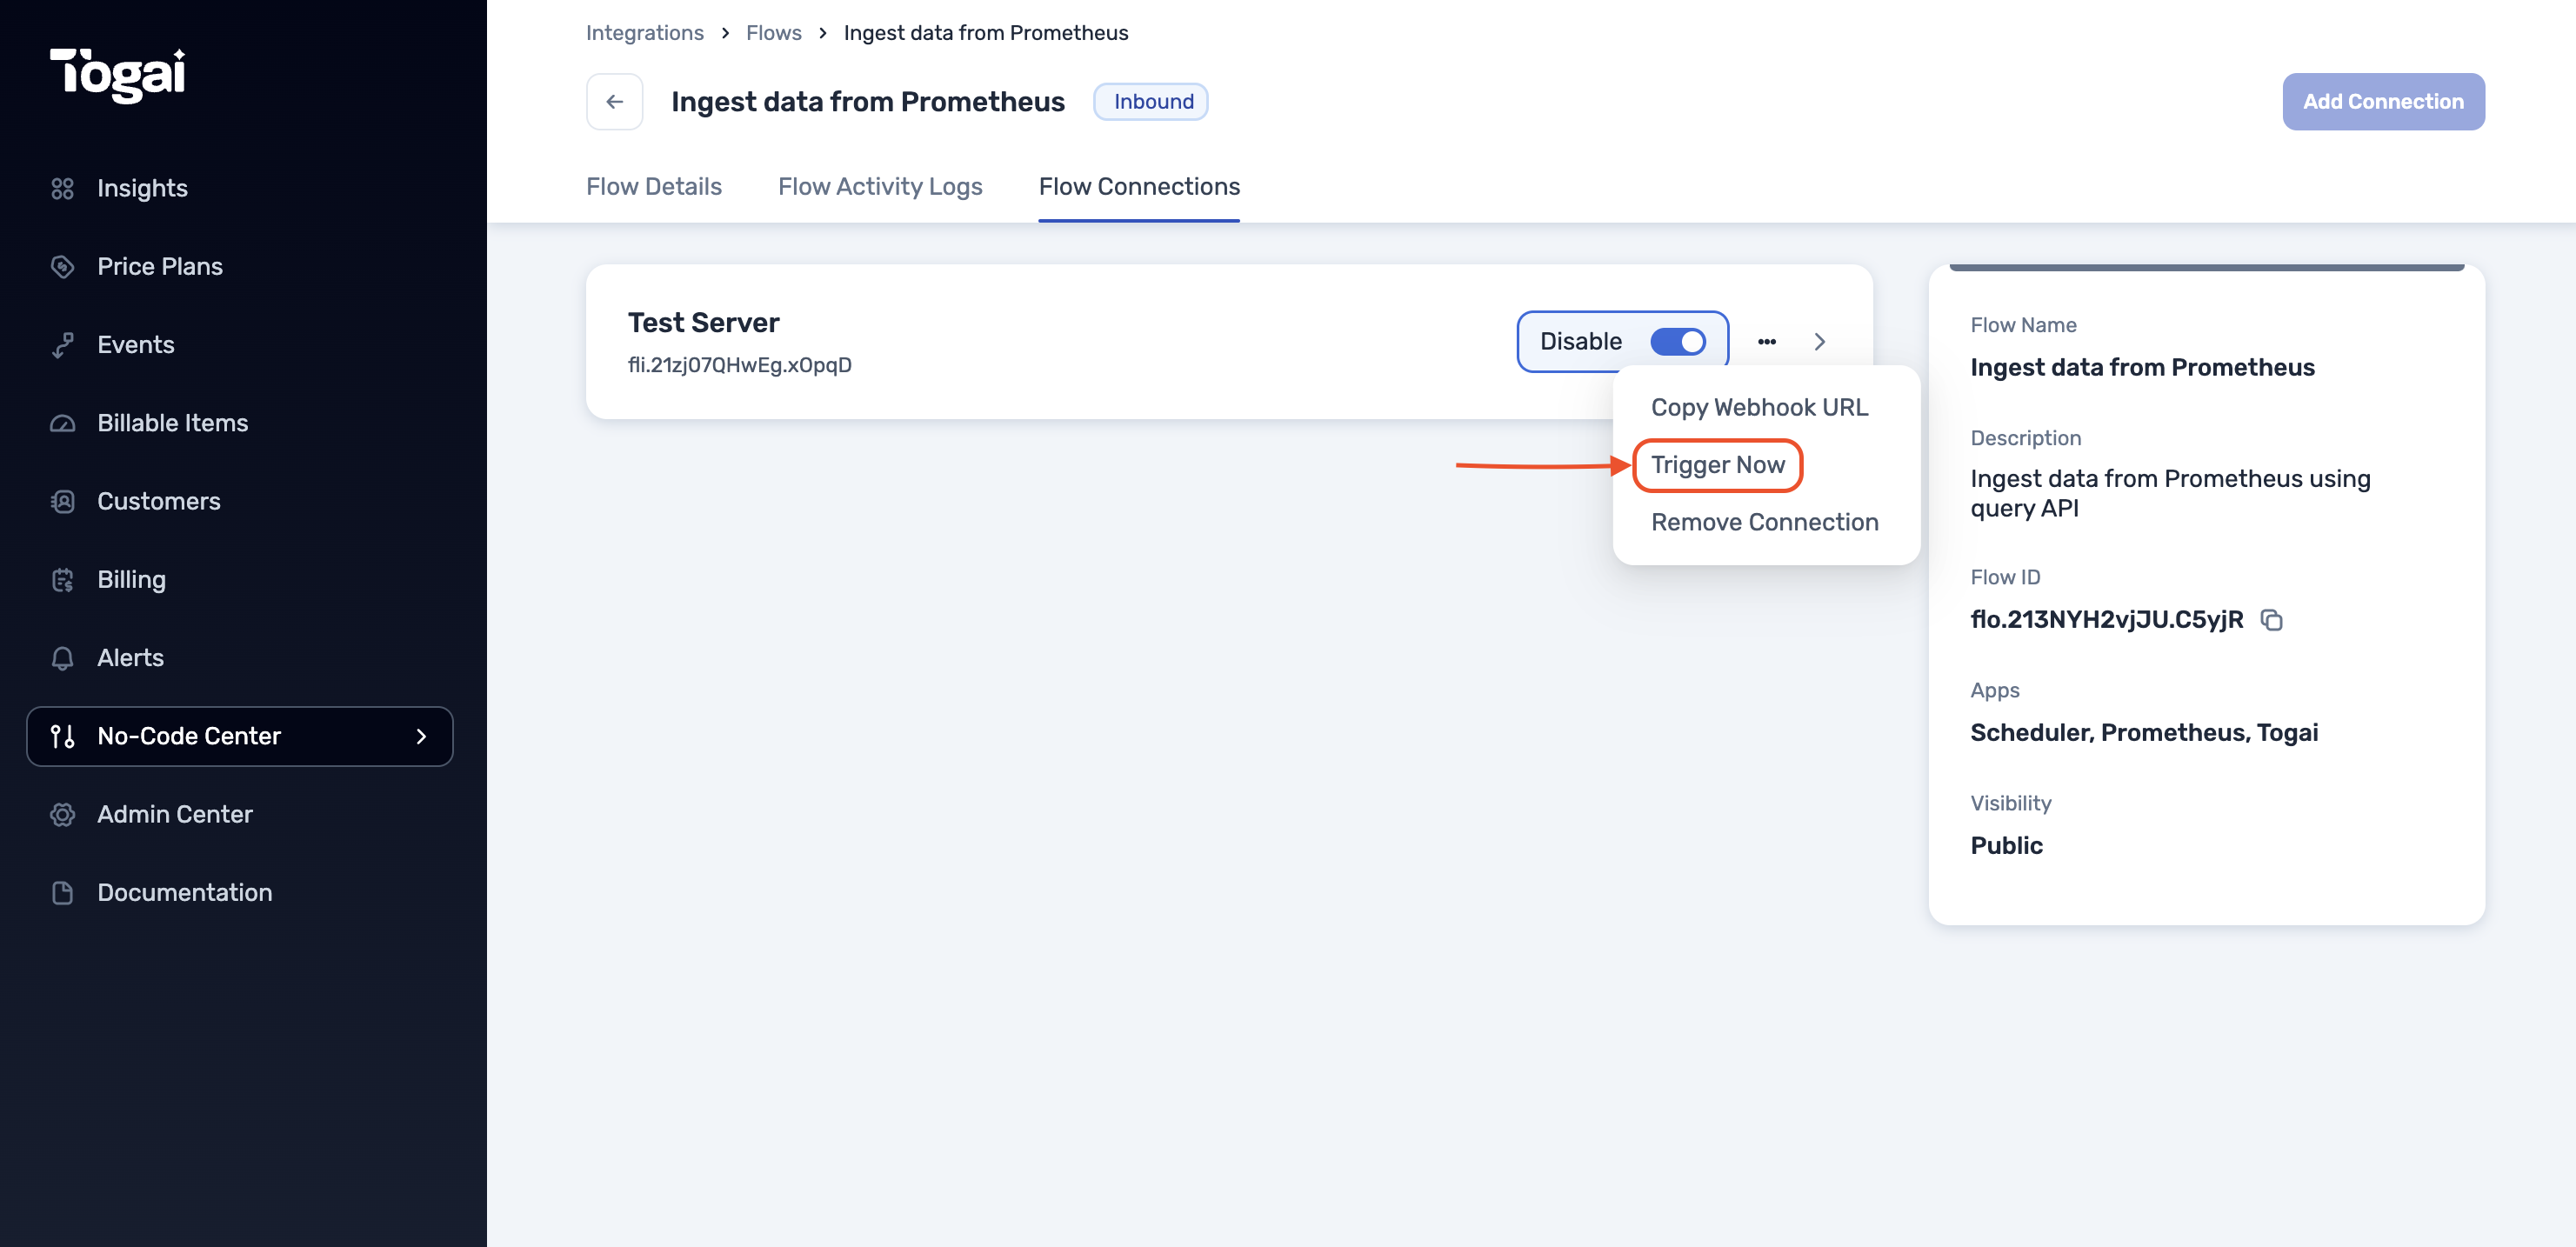
- Once the flow connection is created, navigate to
Flow connectionson the top navigation bar and click on theTrigger nowbutton to trigger the flow.
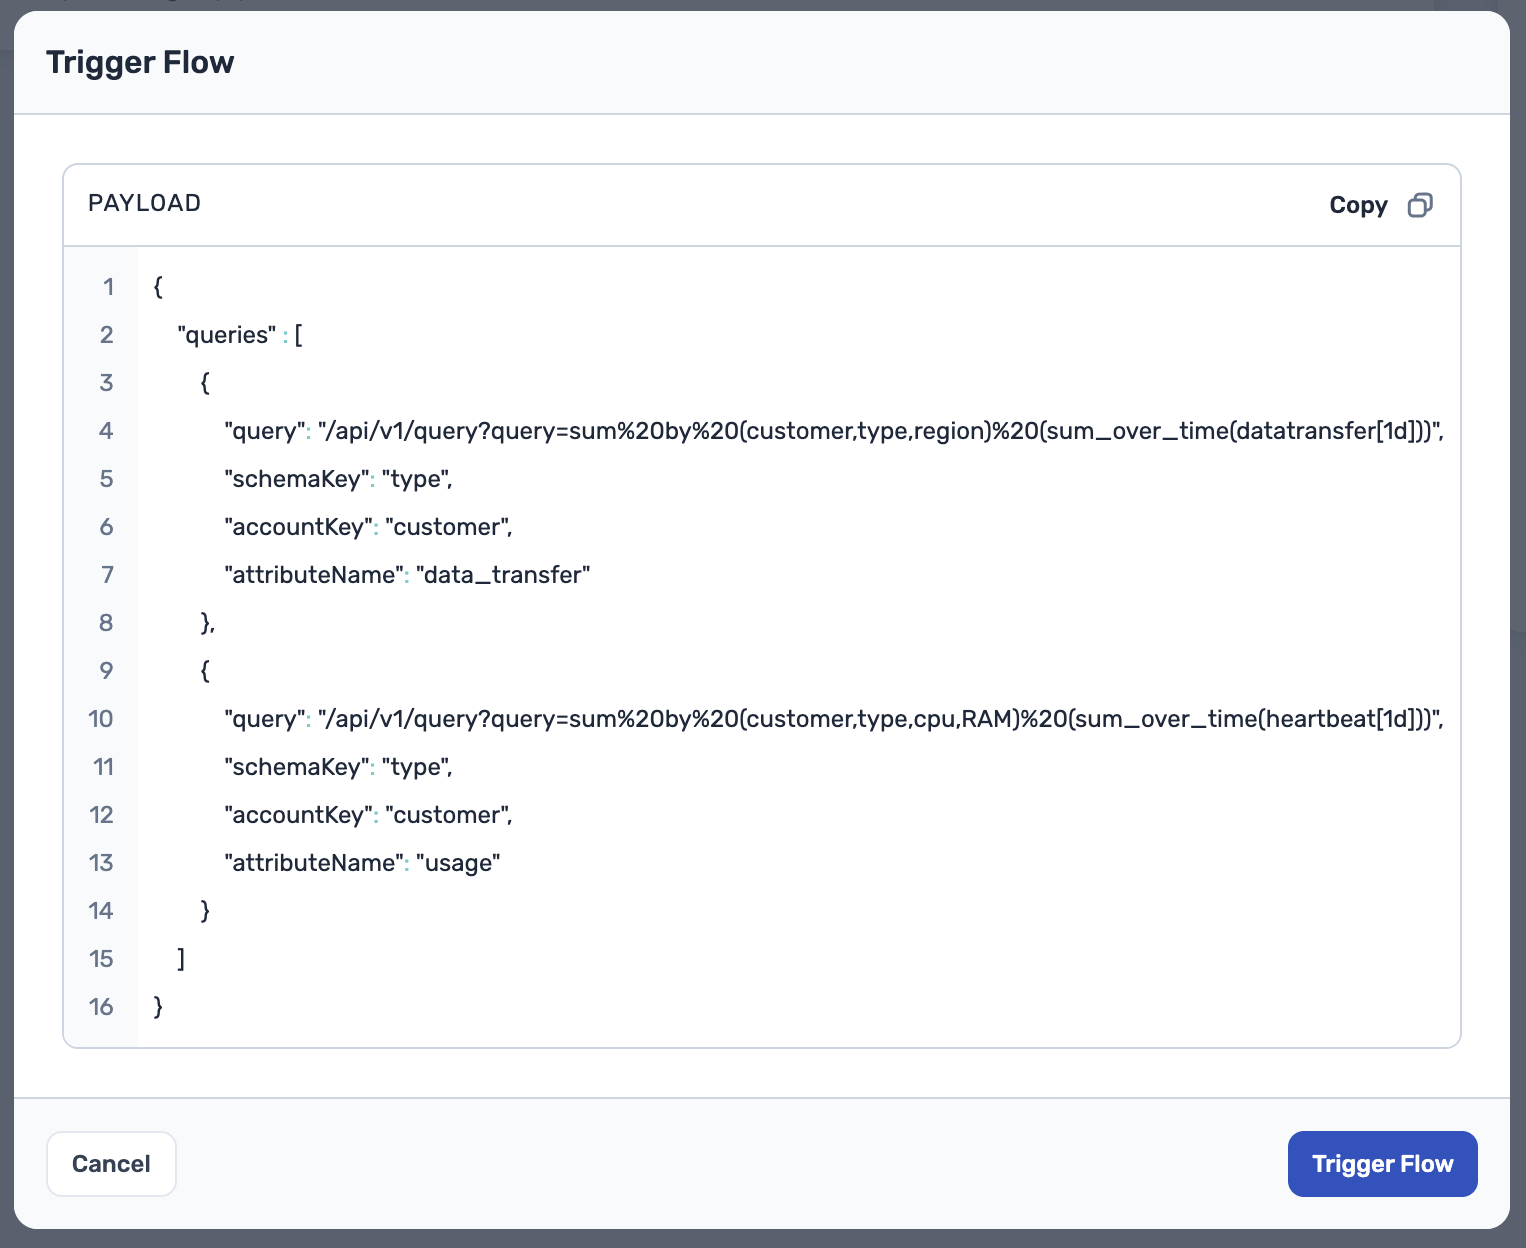
- The flow takes an array of queries:
query: The query to be executed on the Prometheus server, usually the remaining part of the URL after the base URL.schemaKey: The schema key to be used to map the data from Prometheus to the Togai Event Schema.accountKey: The account key to be used to map the data to corresponding Togai Accounts to which the data belongs to.attributeName: The attribute name of a Togai Event Schema to which the queried data should be mapped to.
- The flow will ingest the data from Prometheus as events into Togai.

