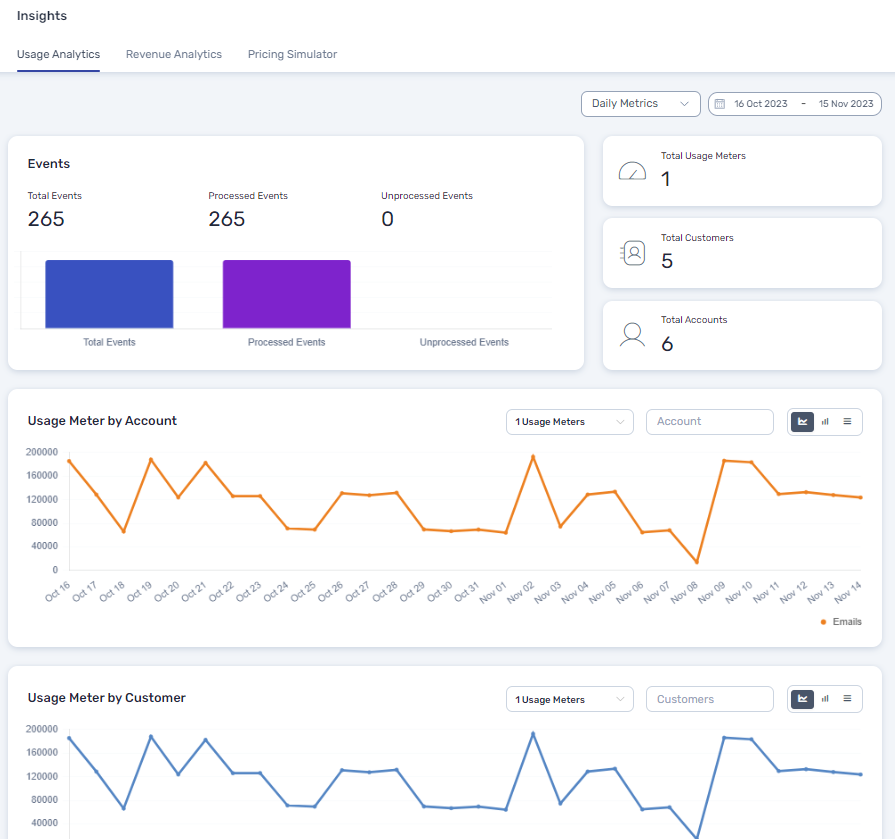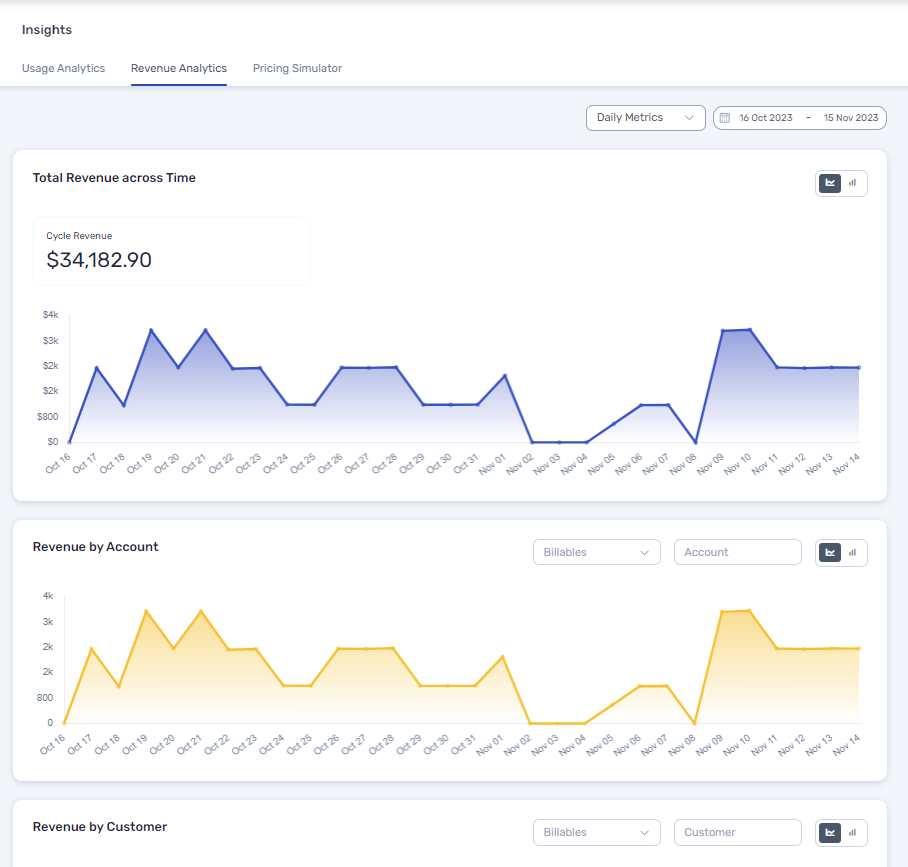

Event, usage and revenue analytics
This is the 1st screen upon logging into your Togai dashboard. Once the configurations are done and the events are flowing through, you can filter based on a date range and view the daily or hourly metrics for events, usage and revenue data points for accounts and customers. You can also view the real-time usage and revenue metrics (time-series data) for each and every billable item or a group of billable items.