

Design principles
- Real-time - Our metering is built to handle workflows where the metrics need to be captured real-time. For a usage based billing model, this is important from both a customer experience standpoint as well as the decision making needs for your organization.
- User experience - What we mean by user experience here is the need to marry simplicity, with optionality and configurability. This translates to providing multiple types of data connections without code. It should be simple enough to configure for basic metering use cases as well as support the flexibility to model complex metering needs with low/no code.
- Independent - A customer should be able to use Togai’s metering as a standalone and autonomous product without having to plug in Togai’s pricing/billing systems.
What is a usage meter?
Usage meters are transformation and aggregation functions on top of raw data that provides you an output in the form of time series. You can also think of the capabilities of a usage meter as an ETL function (but limited to what is required for metering and billing). In short, a usage meter converts a stream of data points into a single output metric.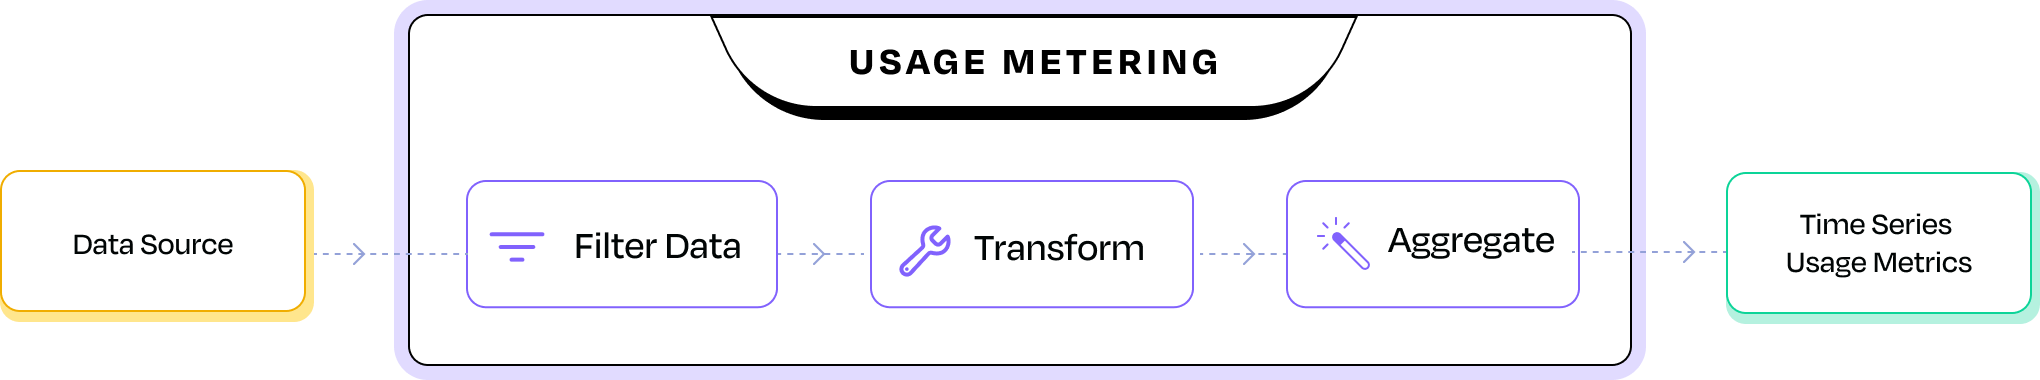
What is usage metering?
- Data source - This is how you connect the usage meter to your raw data source or to a database/data warehouse which houses your metrics.
- Filter data - Once you choose a data source, you can define filters to query your data and then apply the transformation & aggregation.
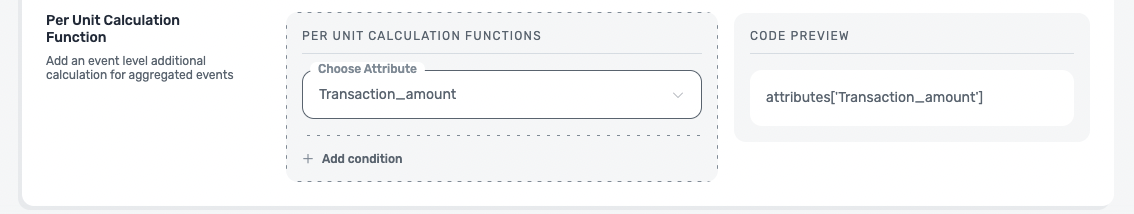
- Transformation - You can define the data point that needs to be aggregated by choosing the attribute/dimension variable or by transforming them into a new variable by applying a custom formula using jsonLogic syntax.
- Aggregation - Choose the aggregation function on your variable to start generating time series usage metrics in real-time for your customers.
In traditional metering systems, you would find ‘Deduplication’ as an addional step. In Togai, the architecture that supports inbuilt idempotency removes the need for a separate step that is used to dedupe your raw event data.
Data source
Connecting your data source
Togai supports 2 models to connect your data -
- You can use Togai to store your raw data, in this case you can use the event schema and ingestion pipeline to capture your raw data for metering.
- You can connect Togai to your existing data source and run queries at pre-defined intervals to retrieve usage metrics and store them in Togai.
Togai as event store
Filtering
You can apply filters on Togai’s event store using attribute and dimension values. You can combine multiple filter options with AND/OR and filter your event data before applying the corresponding transformations and aggregations.Transforming
In Togai, the aggregation happens on a variable that you are looking to meter. Examples of a variable are GBmin for a cloud storage provider, payment value for a transaction, number of entities and dimensions for a vector database. The variable to be aggregated can be directly taken from the event schema that you have defined or from a transformation you can define. The transformation logic can be applied using jsonLogic syntax on top of the different attributes, dimensions or enrichments from your event schema.Aggregation
The usage meter is essentially an aggregated output that will be rated based on your pricing configurations. You can define the aggregation function to be used while creating a usage meter. Togai supports multiple aggregation types -External data source
Togai supports data source connections via -- SQL - JDBC url
- HTTP - Endpoint, headers with authentication details
SQL query builder
When you connect an external data source that supports SQL, you can use Togai to define queries and pull data from your data source periodically. The query output has to be an individual number for every customer account id. One customer account id cannot have multiple data points and if that happens, the query will fail and will be unprocessed for that interval. There are 2 other inputs that are required - account ID and the frequency of querying. You need to define which column in your data source contains your account ID. The supported frequencies for the query builder are Hourly, Daily, Weekly, Monthly, Never (Never implies you are not looking to use Togai for metering but only for billing. The data will be retrieved only when the invoice is generated.)If you are looking for a real-time metering solution, we suggest you go with using Togai as your event store and send us real-time data. Togai is built to handle this for high throughput and you can replace your data source with Togai, which will be cost effective.
Metering example for a payment platform
Here’s an example of how to go about creating usage meters that shows when to use which aggregation type. Let’s take the example of Stripe Payments. This is what their pricing looks like: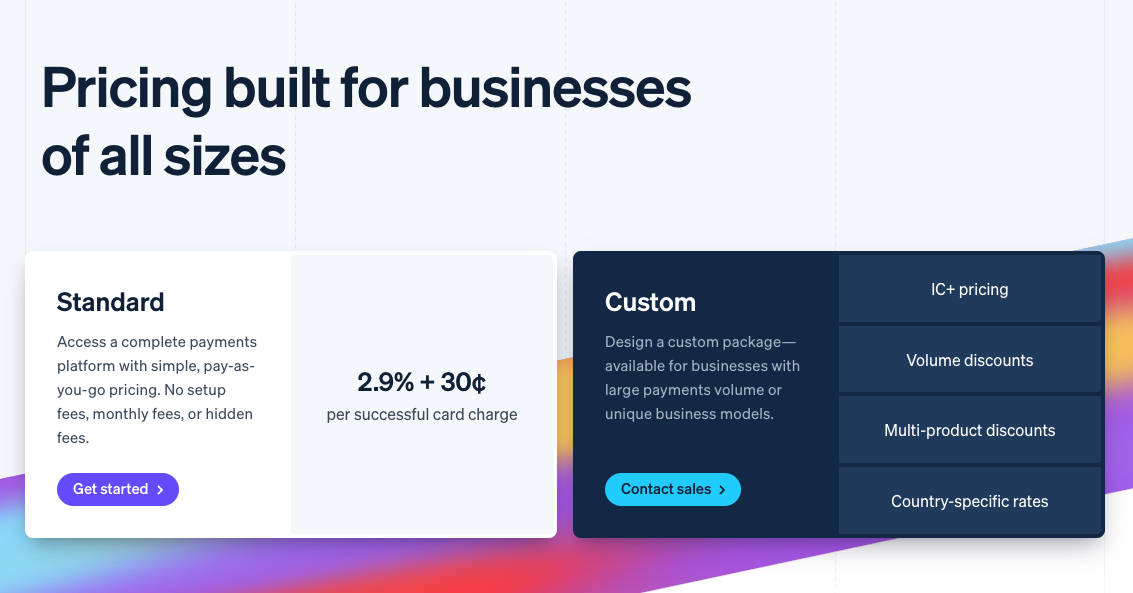
2.9% + 30¢ per successful card charge.
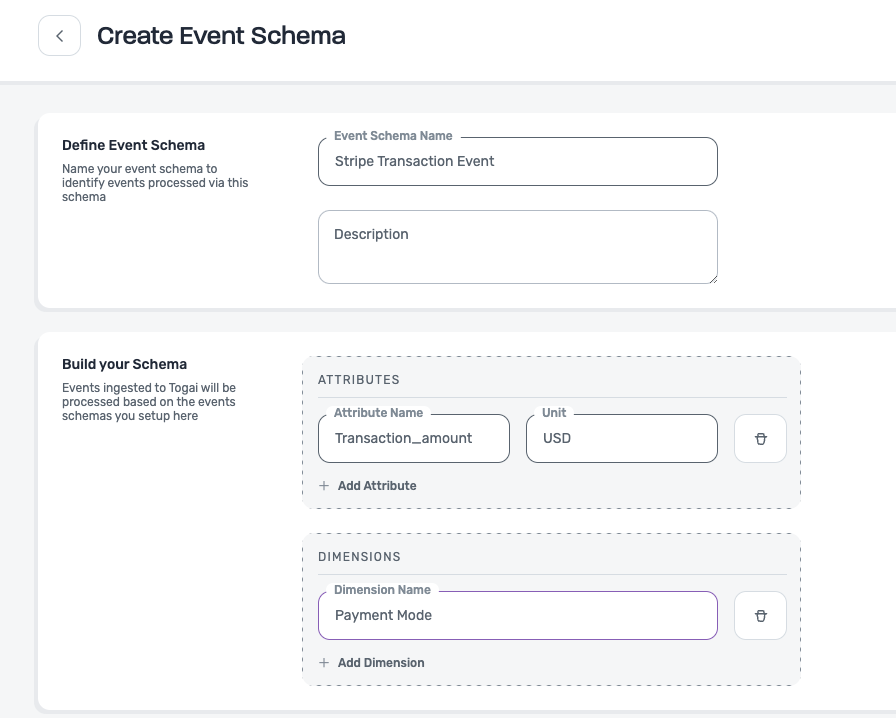
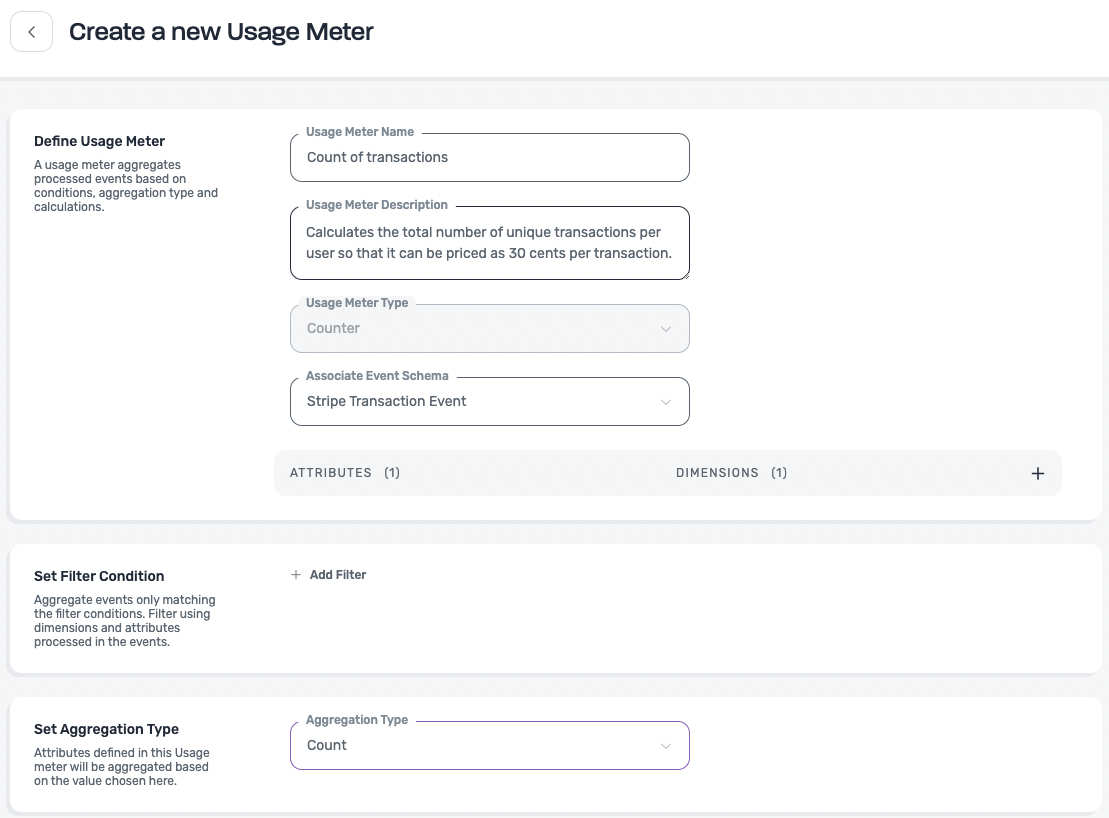
To model this 2-part pricing of Stripe, you’ll need to create two usage meters. The event schema to be associated to both the usage meters will look like this:
- Attribute: Transaction_amount (Unit as USD)
- Payment Mode: This is incase Stripe wants to charge differently or just segment users based on the Payment mode (Debit card, ACH etc).
**2.9% of transaction amount**.
In this case, we need to sum the total transaction amount across various transactions for a particular user and then calculate 2.9% of that.
Clearly, this requires us to use the sum function and so we set the aggregation type to Sum.
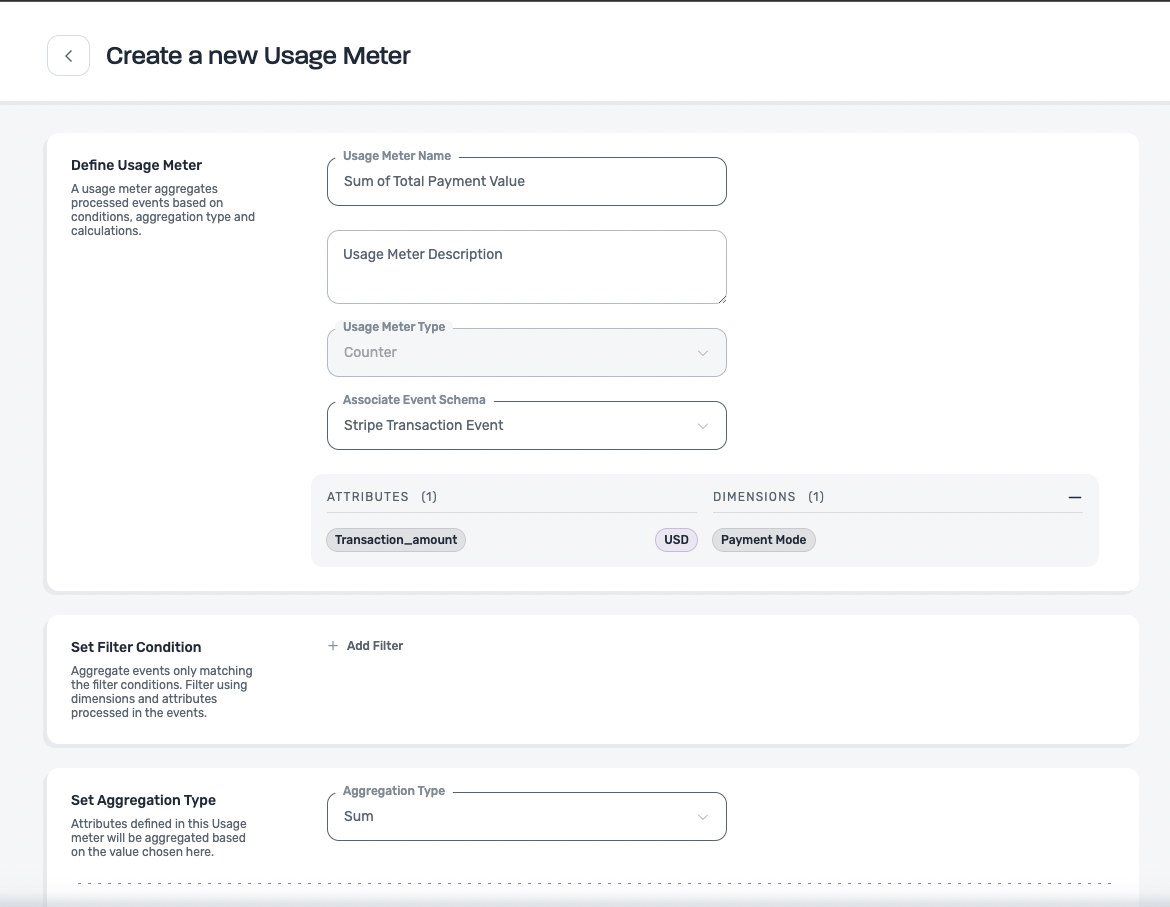
Payment Mode as a filter condition.
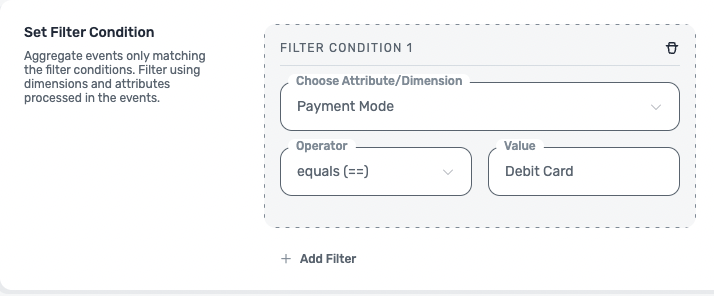
**30¢ per transaction**.
In this case, for every unique transaction done by a user we need to increase the counter by 1. So that we can then multiply the final number of the counter with 30 (cents).
This requires us to use the count function and so we set the aggregation type to Count.
Usage meter lifecycle
- Draft - Usage meters can be created in a draft mode. Draft mode is meant to be used when you want to create a test meter and edit it as required. You can add/edit/delete the configurations in a draft state. Usage meters in draft mode cannot be associated with a price plan. You can also archive a usage meter that is in draft state. When you save a usage meter in the draft state, its status will be shown as ‘Inactive’
- Active - You can publish Usage meters directly to create it in an ‘Active’ state. You can also toggle an ‘Inactive’ schema to an ‘Active’ state and vice versa. Currently, you cannot edit an Active usage meter.
Active meters can be deactivated only if they do not have any price plans associated with them.
- Archive - You can archive an Inactive Usage meter. Archived meters are not displayed in the dashboard but would still be stored within Togai.
You cannot delete Usage meters from Togai currently. If you do have the need to delete a meter, please reach out to us and we can help you with it.