> ## Documentation Index
> Fetch the complete documentation index at: https://docs.togai.com/llms.txt
> Use this file to discover all available pages before exploring further.
# Prometheus
Prometheus.io is an open-source monitoring and alerting toolkit widely used in the IT industry, empowering organizations to gather and analyze metrics from their systems to ensure optimal performance and reliability.
The integration between **Prometheus** and **Togai** requires only a one-time setup. Follow the steps below:
## Install
* Navigate to the Integrations section from the left navigation bar in Togai
* Click on `Apps` to access the list of apps with integration support
* Select `Prometheus` from the available apps
* Click on the `+Add connection` button
* Provide a name for the connection and paste your:
* `Base URL`
### Base URL
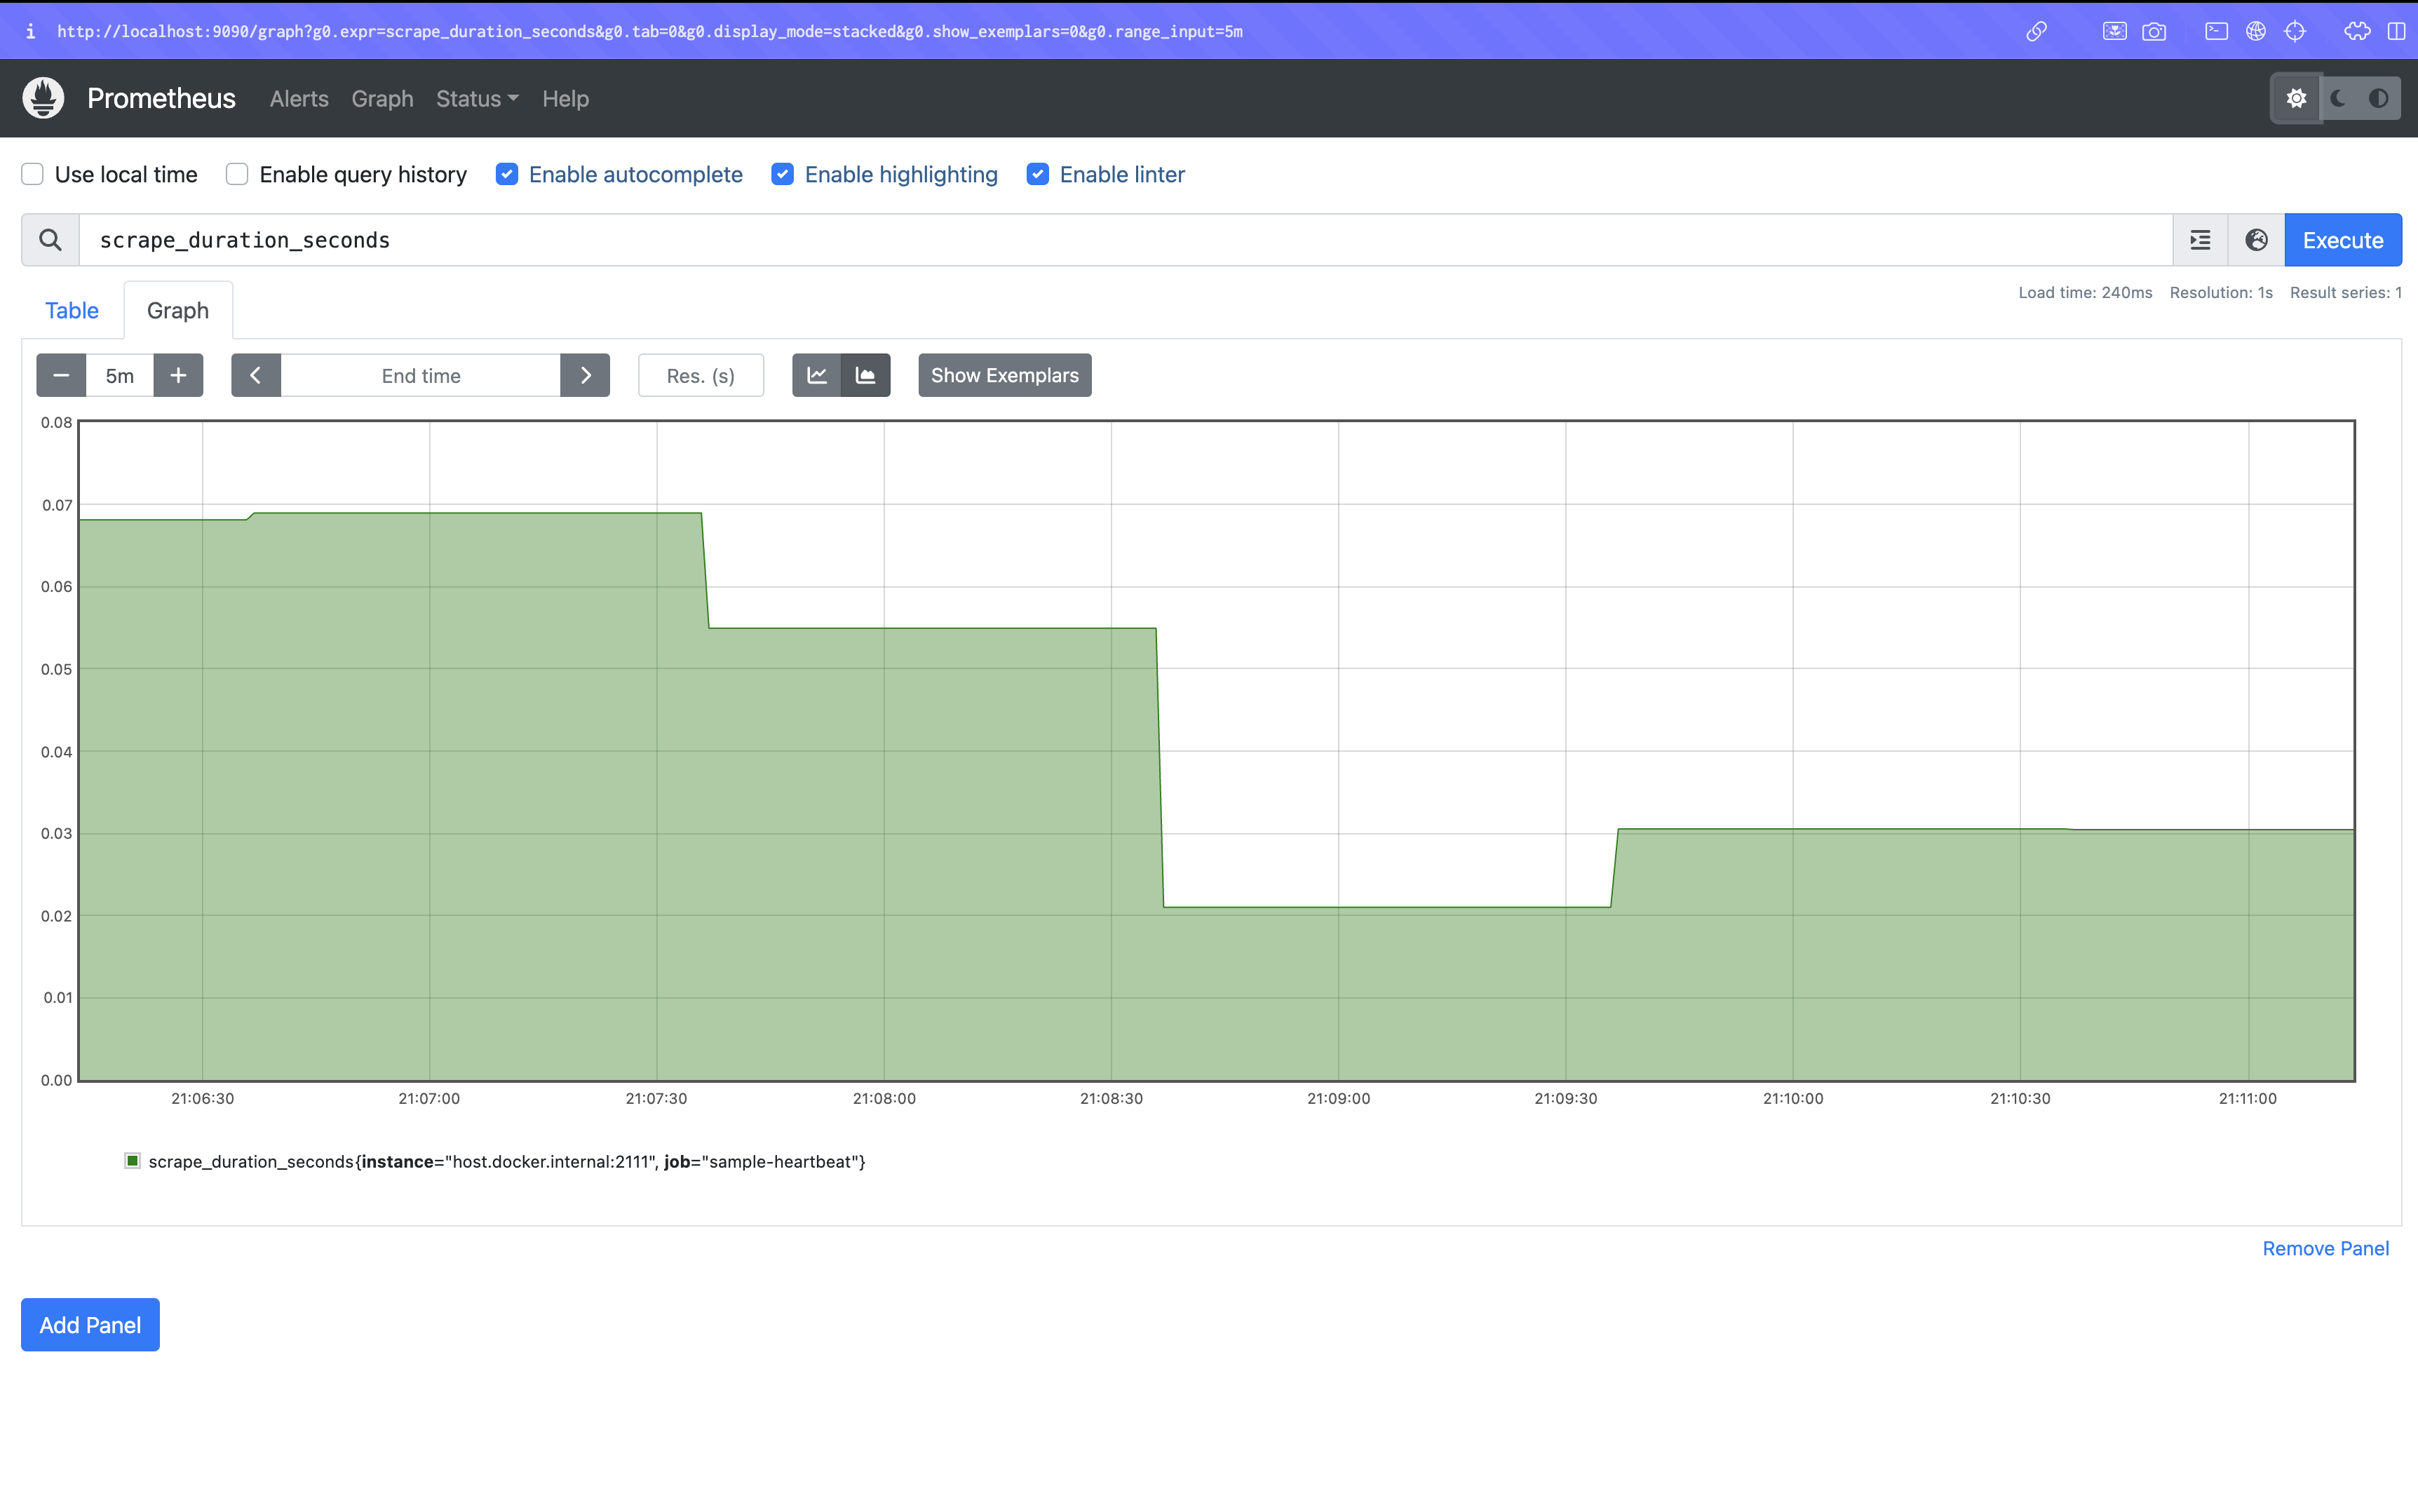 * Obtain the network address of your Prometheus instance. This is the address you use to access the Prometheus server. It is usually in the format `http://:`. For example, `http://localhost:9090` when running locally.
* Paste the network address in the `Base URL` field in Togai.
In order to access the Prometheus server from outside the local network, you need to expose the Prometheus server port. You can use a tool like [ngrok](https://ngrok.com/) to expose the Prometheus server port.
## Flows
### 1. Ingest data from Prometheus
* The flow can be triggered by on demand triggered.
* Create flow connection by choosing the appropriate app connections from the dropdown.
* Obtain the network address of your Prometheus instance. This is the address you use to access the Prometheus server. It is usually in the format `http://:`. For example, `http://localhost:9090` when running locally.
* Paste the network address in the `Base URL` field in Togai.
In order to access the Prometheus server from outside the local network, you need to expose the Prometheus server port. You can use a tool like [ngrok](https://ngrok.com/) to expose the Prometheus server port.
## Flows
### 1. Ingest data from Prometheus
* The flow can be triggered by on demand triggered.
* Create flow connection by choosing the appropriate app connections from the dropdown.
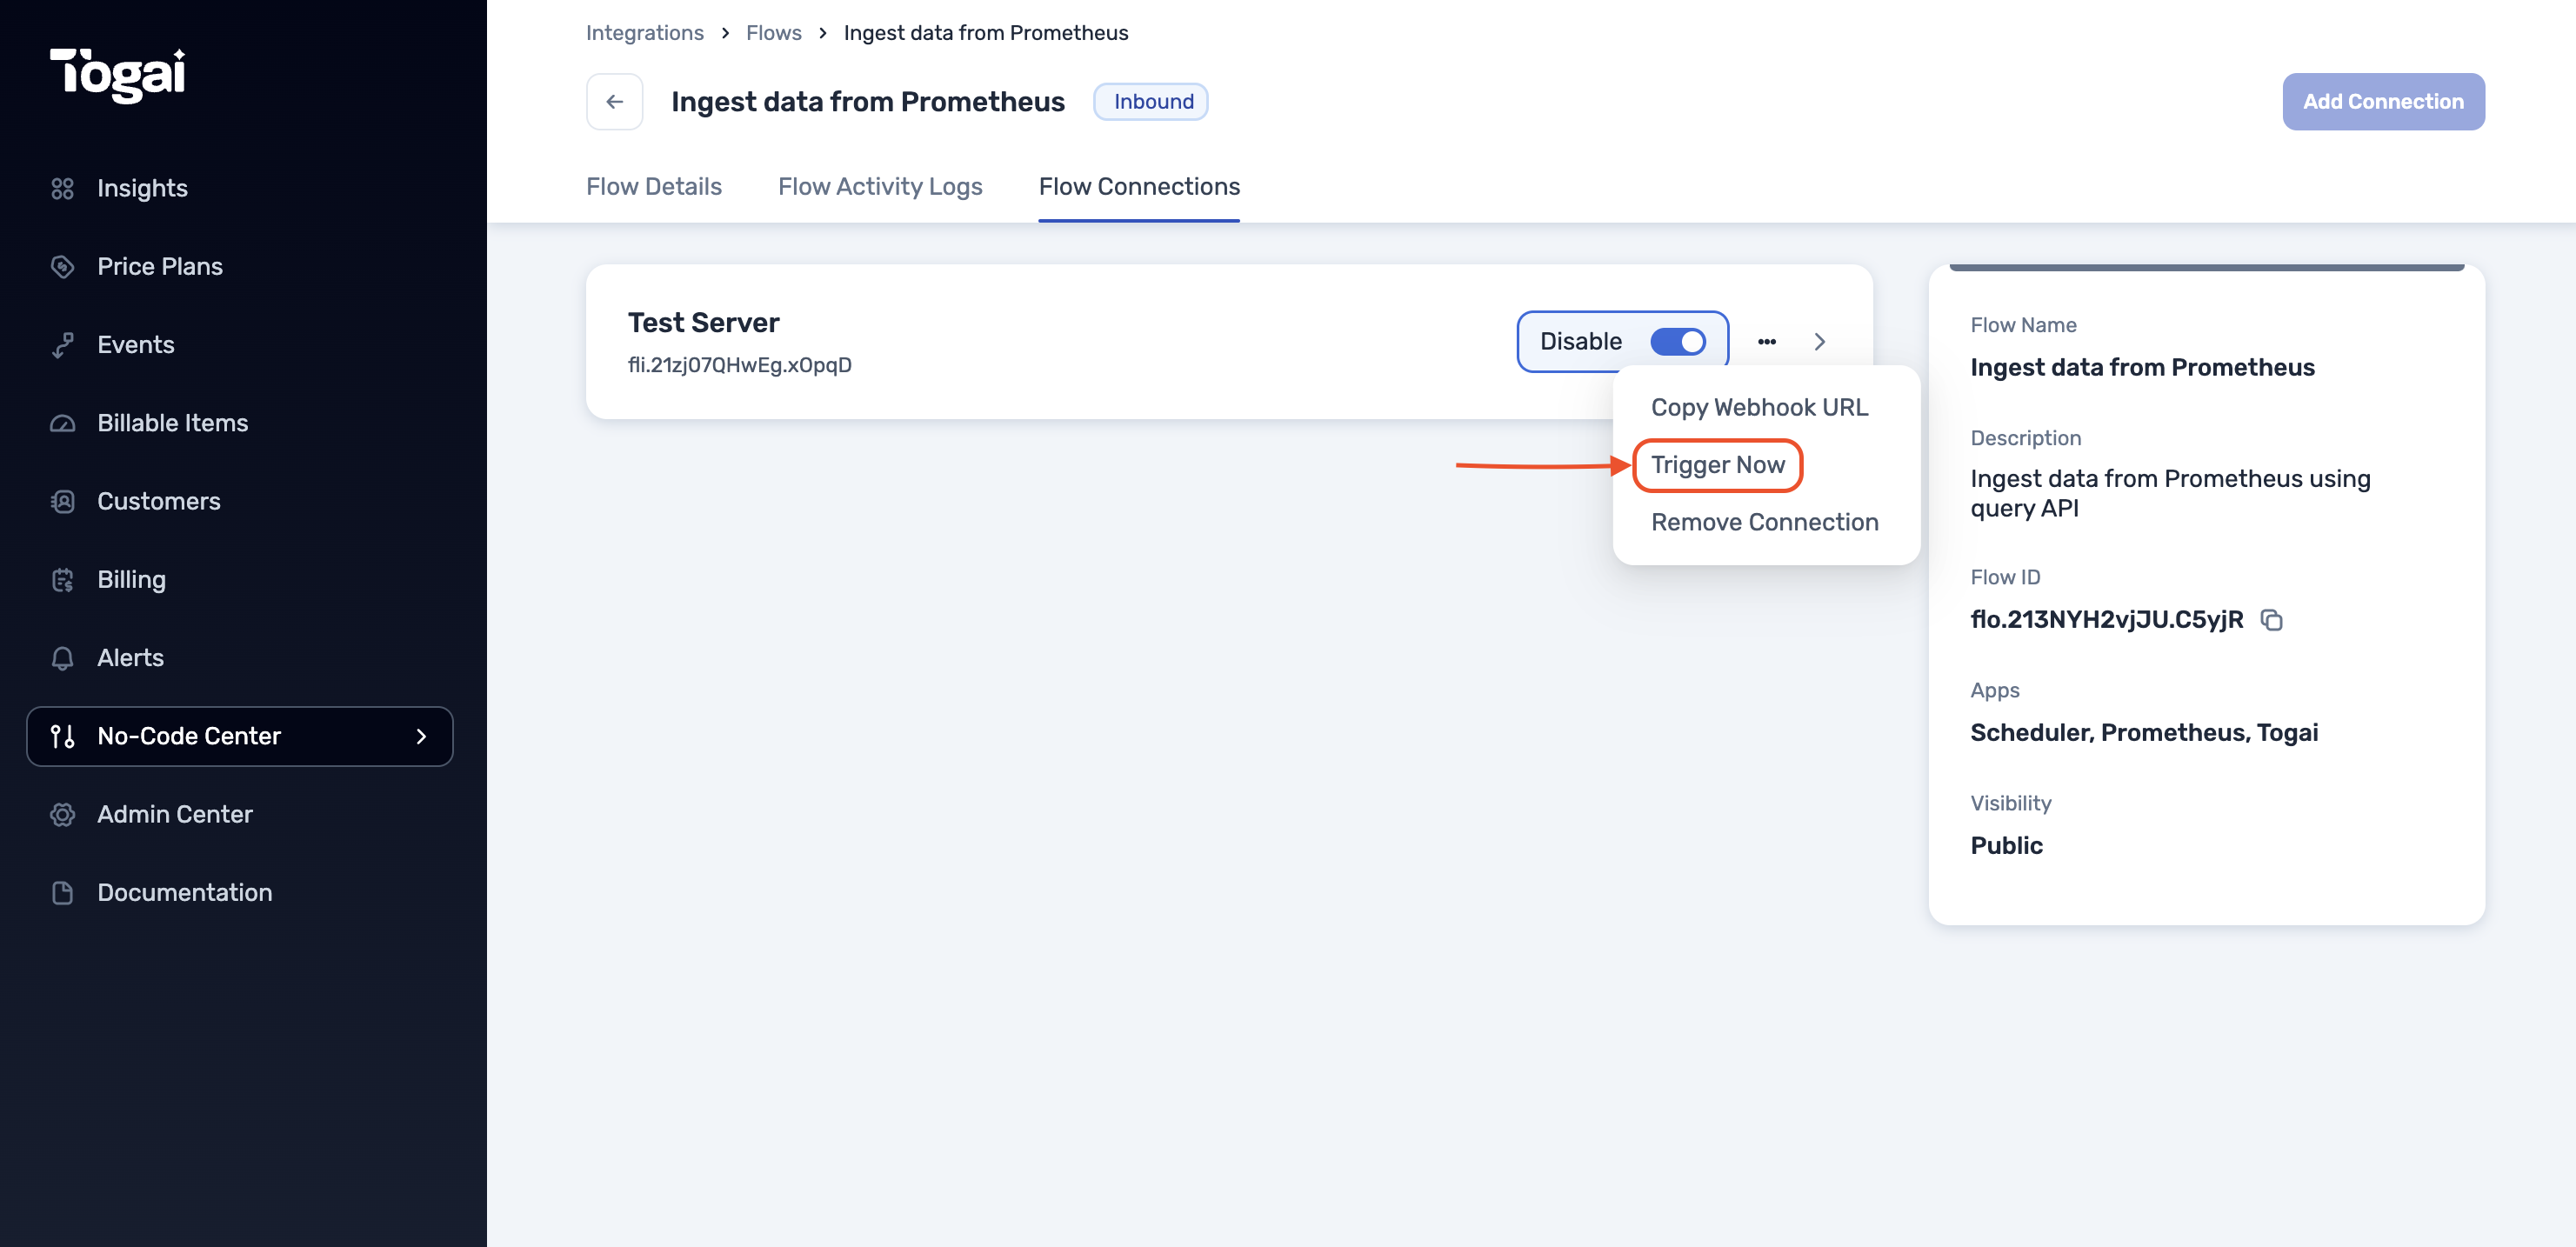 * Once the flow connection is created, navigate to `Flow connections` on the top navigation bar and click on the `Trigger now` button to trigger the flow.
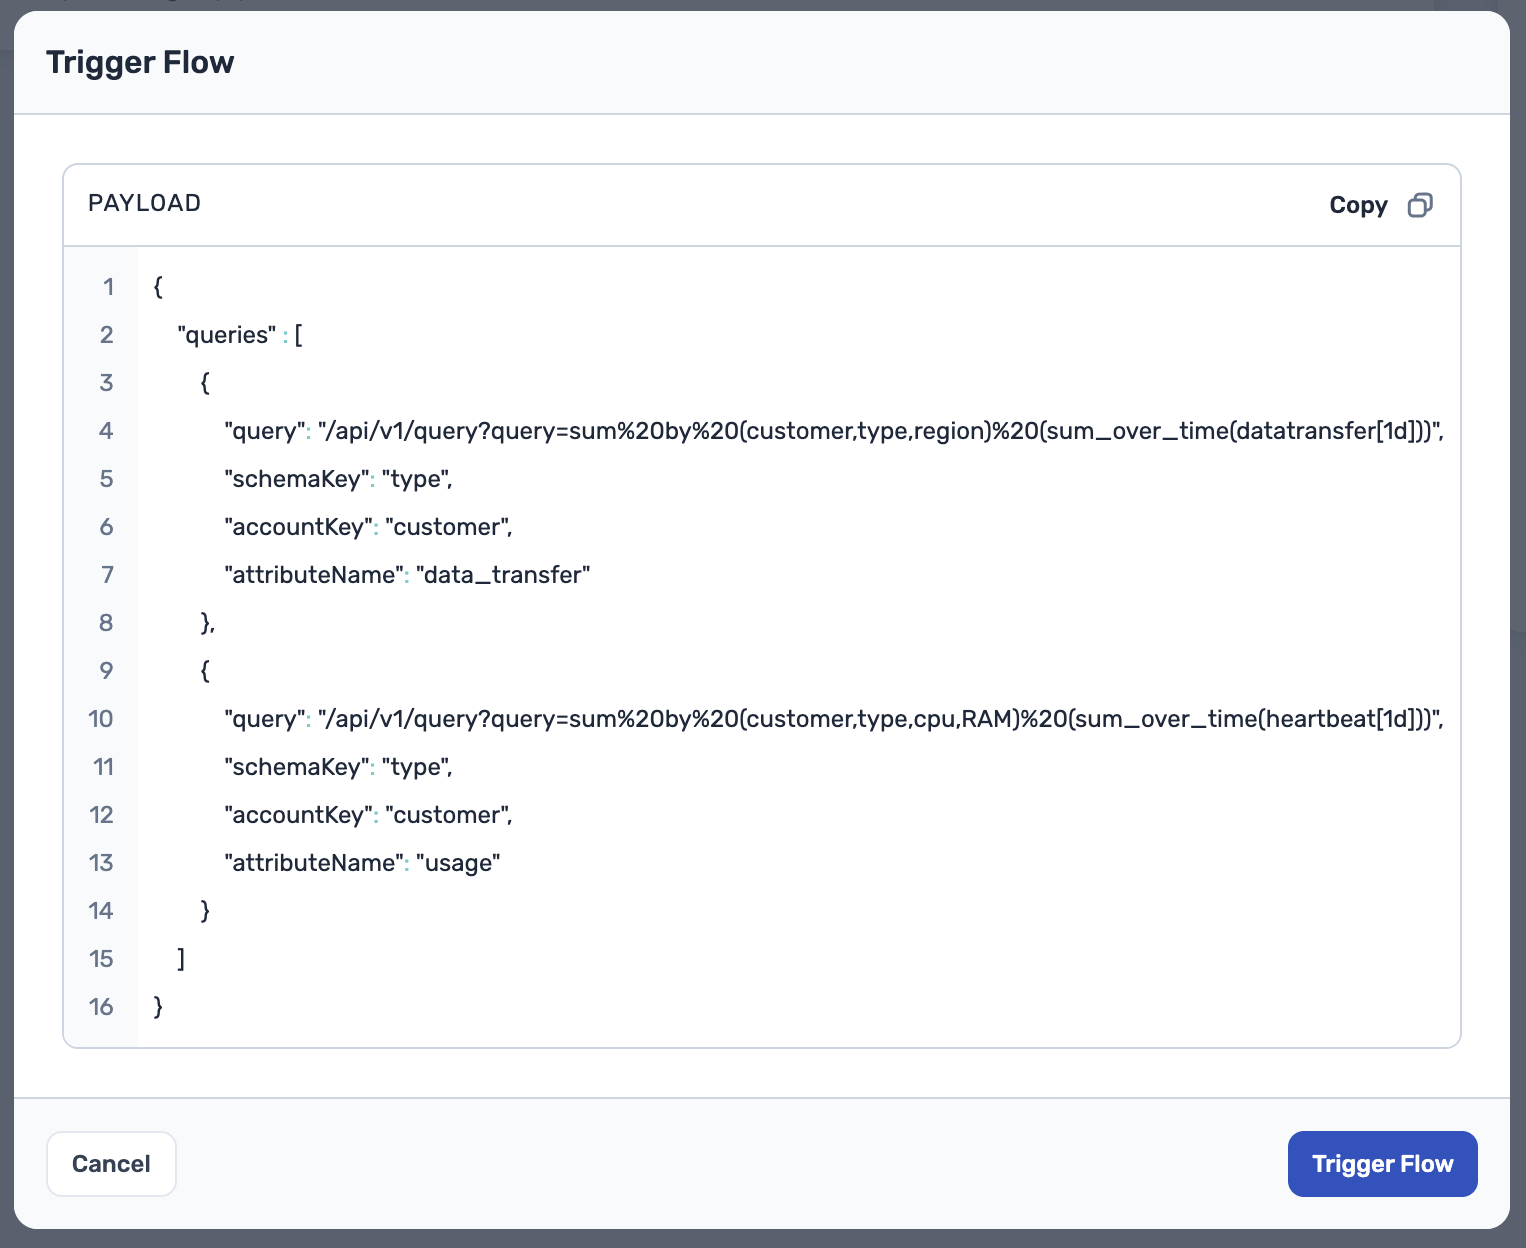 * The flow takes an array of queries:
* `query`: The query to be executed on the Prometheus server, usually the remaining part of the URL after the base URL.
* `schemaKey`: The schema key to be used to map the data from Prometheus to the Togai Event Schema.
* `accountKey`: The account key to be used to map the data to corresponding Togai Accounts to which the data belongs to.
* `attributeName`: The attribute name of a Togai Event Schema to which the queried data should be mapped to.
* The flow will ingest the data from Prometheus as events into Togai.
* The flow takes an array of queries:
* `query`: The query to be executed on the Prometheus server, usually the remaining part of the URL after the base URL.
* `schemaKey`: The schema key to be used to map the data from Prometheus to the Togai Event Schema.
* `accountKey`: The account key to be used to map the data to corresponding Togai Accounts to which the data belongs to.
* `attributeName`: The attribute name of a Togai Event Schema to which the queried data should be mapped to.
* The flow will ingest the data from Prometheus as events into Togai.